Logging in C++, before and now
One of the first things I used to make when I started a new project a few decades ago was the logging functions. For simple projects, the logger was simple. For larger projects, the logger could be quite complex and flexible. For example, some of my projects had feature log switches, each with their own individual log level. The idea was that I might need to investigate something related to network I/O or authentication. To do that, without drowning in log messages, I could enable debug level or one of several trace levels for that feature, and maintain info level on everything else. That worked nicely. I could even enable debug level on some features to get a better picture of what was going on, and a trace level on the feature I was investigating.
Then, the next thing would be maybe the socket classes (built on top of POSIX sockets or Winsock, or both, depending on the platform), and then higher-level protocols like HTTP, SMTP or FTP. And then the “business logic” that made the actual application. That’s how C++ projects were made in the stone age.
Then we started to build huge libraries and “frameworks” to avoid reinventing lots of wheels again and again for each project we worked on. My general library grew to over 100k lines of code. It had a flexible logger, several internet protocols, and many specialized subfunctions I used in commercial projects, like signing XML documents, working with SSL certificates and sending SMS messages. Then we started to write smaller, simpler stand-alone libraries for all kinds of things. And that’s where we are today.
Unlike Java, which (last time I worked commercially with it) mostly used Log4j (a nightmare disguised as a Java library), we have many log libraries for C++. And we have real choices about how we want to do logging. Some people prefer Java-like function-based logging, while others prefer C++’s streaming operator for logging. The advantage of the streaming operator is that it usually supports the general formatting of objects to stream that many libraries provide as part of their API. And if they don’t, it’s usually easy to add. The stream operator from an object to std::ostream is often useful for other use cases than just logging.
Unfortunately, we don’t have a generic and uniform transformation of any object to string in C++, like Rust’s .to_string() function. The closest we get is the stream operator to std::ostream. In my code I often create overloads to transform even enums to strings to make the logs easier to read. For example:
std::ostream& In such code I either use names.at() to trigger an exception on overflow if performance is of less concern, or names[] if it is. But then with an additional assert() in front of it to catch overflow (typically if I add an enum value and forget to update the operator).
Of course, with C++20, we can also add a std::formatter<openvalify::CertInfo::Result> to achieve the same using std::format(). The latter should typically yield better performance, since std::ostream is a bit heavy on the CPU.
When it comes to logging, we typically start by choosing between the Java style:
;Or the C++ streams operator style:
LOG_INFO << "Log entry #" << i << ": " << data;(Here we assume that there is a stream operator declared for data’s type).
Personally, I have always preferred the stream style.
The second thing to choose is the destination(s). Traditionally, we always wrote to a file or the system logger. On Windows the system logger is the Event Log. In most Linux and Unix systems we had syslog. Today we are so lucky, if we use Linux, that we can even use the systemd API for logging 🤮.
A decent log library will allow you to use more than one destination, and assign different log levels to each. For example, when I write a daemon (server) today, I usually have INFO-level output to standard output, and DEBUG or TRACE level on a log file while I am developing it. That gives me the overview of what’s going on in the console or in Qt Creator, and if I need to dig into something, I have the log file open in a log viewer that colorizes the log based on severity.
The third thing to decide upon is the format of the output. Some loggers will give you plenty of flexibility here. However, if your app or daemon will be running in the cloud, and the logs collected and handled by some scalable log management software, you need to choose between legacy text messages for the log events and JSON messages. I use Grafana Loki to collect and handle the logs from my cloud daemons. For that, JSON messages work best for me (I have tried both). Interestingly, neither Boost.Log nor spdlog, two of the more popular logging libraries for C++ today, supports JSON format out of the box. You can fake it by formatting the text output like JSON, but if you log something that requires escaping for JSON, like a double quote (") inside a string, they will both break the formatting and output gibberish.
Lazy evaluation and compile-time filtering
Another issue is how the log library works with things you don’t actually log. In a real application you typically log all important events at INFO level. Then you add more verbose info on DEBUG level for things that are highly relevant to understand exactly what the server is doing. Then you add logging from low-level operations with lots of detail at TRACE level. An HTTP server may output one line per request on INFO level (the target, the peers IP address and port, status code and maybe the time it spent to process the request). Then on DEBUG level you may get 10 more messages per request about authentication, MIME types, cache lookups, TLS info etc. On TRACE level you may get 100 more messages with lots of details about internal parsers, what functions were used, how the content was processed, and all I/O events related to the request. If you run a daemon with production load simulation, or load testing, with all logging enabled, don’t be surprised if 80–95% of the CPU is spent on logging. That’s OK. Because in a production setting, with logging on INFO or WARNING level, the log volume will be low and the resources spent on logging should be insignificant.
However, there is one big caveat. Writing the log to a file is only a small part of the overhead with logging. There is also overhead when calling the log function and expanding all the information in the log statement. For example, in the example above, LOG_INFO << "Log entry #" << i << ": " << data; will call some log function, then it will serialize the data sent to the stream operator and then potentially send that to another function for the actual logging. If the current log level is WARNING in the example above, we should not need to call any of the streaming overloads. If we do, it contradicts C++’s principle of only paying for what we use.
Even if we use lazy evaluation of the full log statement and check the log level before evaluating anything else, we will still pay a small price for all the TRACE-level evaluations. If we have 1000 log statements at TRACE level for each log statement on INFO level, the evaluation of the log level for the TRACE statements is likely to end up on the first pages in perf report if you do a performance measurement for your daemon. A good log library should therefore allow you to enable a compile-time filter that can filter out all TRACE or even DEBUG messages from a release build. If there is a constexpr comparison to check this before evaluating the log level, then the compiler will optimize away all the TRACE log statements, just as effectively as if they were inside an #ifdef block. The library can of course also use actual #ifdefs and replace some log functions with empty functions that don’t expand to anything.
Think of logging at TRACE level as assert()'s. They should be enabled when we debug and test our code, but disabled and totally absent from the binaries we use for performance testing and production.
You can visualise an individual log statements as:
if ; }When I talk about lazy evaluation, this is what I mean. The log statement should only be reached if its level is within the range of what we are currently logging. Logfault does this by using simple macros like the one below.
/* Constexpr evaluation for compile time filtering */ && \ . /* Evaluation of log-level */ && \ . /* Returns reference to a std::ostream compatible variable. ~Log() will submit the log event. */// Later in our codeLFLOG_INFO << "Log message...";Simple performance test
When I started on this blog post I did some comparisons between my own logfault log library and Boost.Log / spdlog. They are both faster than logfault on raw output. That’s logical, as logfault uses native std::ostream which is, well, a bit heavy on the CPU. I will probably fix that one day. But lazy evaluation and compile-time filtering make it totally fine for all the projects I work with today, from the Android version of NextApp, to nsblast, my massively scalable authoritative DNS server.
Boost.Log, however, did eager evaluation for log statements, so using it I paid the full price for every log statement at any level. That made it very slow when I tested with 100x DEBUG and 200x TRACE amplification, but still logged only at INFO level. Spdlog seemed to use lazy evaluation, so it was very fast no matter the amplification at levels that were not logged. Both logfault and spdlog support compile-time filtering of the log level.
My very crude performance test logs 1 million events at INFO level to standard output (redirected to /dev/null) on a single thread, using spdlog, Boost.Log or logfault. The loggers are configured to log at INFO level. The test has debug and trace amplification of x, which means that for each message at INFO, there will be x messages on DEBUG level and x messages on TRACE level. Both logfault and spdlog are configured to filter out TRACE messages at compile time. However, spdlog does this by redefining some macros.
When I created the test, I wrote one for logfault, and then I asked ChatGPT-4 to write one for Boost.Log and spdlog. For spdlog, the generated code did not use the macros, but the log function. I asked ChatGPT-5 to fix that and use macros to enable compile time filtering. The resulting code ended up doing eager evaluation on DEBUG level, making the test take 0m14,712s on 100x DEBUG amplification. So I left the results with the original code. This shows once again that performance-critical code must be tested and evaluated before it’s used in an application. It also shows the pitfalls of designing things that are too complex.
Results: 1 million INFO events, single-threaded, output redirected to /dev/null:
| Logger | Debug x | Trace x | result | |-----------|---------|---------|-----------| | spdlog | 100 | 200 | 0m1,336s | | spdlog | 0 | 200 | 0m1,145s | | spdlog | 0 | 0 | 0m0,752s | | Boost.Log | 100 | 200 | 1m14,030s | | Boost.Log | 0 | 200 | 0m49,115s | | Boost.Log | 0 | 0 | 0m1,408s | | logfault | 100 | 200 | 0m3,458s | | logfault | 0 | 200 | 0m3,379s | | logfault | 0 | 0 | 0m3,372s |Another unexpected finding was that Boost.Uuid is pretty slow when used at this scale. Initially I wrote the test with one UUID on each logged line. However, the overhead from generating and serializing the UUIDs was so large that I dropped it. They added about 7 seconds to the test when logging 1 million INFO events.
Unintended consequences
Recently Nextcloud on my devices started to complain about failing to replicate data to the server. When I checked the server, it turned out that the disk was full. I deleted all old versions of files and some cache dirs, but the disk was still pretty full. When I started to look for what directories and files used the most space, I found a 24GB log file from Nextcloud. The thing had been logging to the same uncompressed file for years, until the disk went full.
That’s one thing to keep in mind when thinking about how to do logging in your daemon. If Nextcloud had been smart enough to just log to console when I ran it in their official container, Docker and Loki would have handled the retention of the log. If you plan to log to files in production, and you need some retention for logs, then you must factor that in and use some kind of log rotation.
I used to have support for log rotation in my log libraries, but today I don’t. All the daemons are designed to run as containers, so there are normally no log files in production. I only use log files during development when I run the daemons directly on my PC. For desktop and mobile apps, I do log to files, but then I usually set a flag/option to truncate the log when the app starts. For a desktop app it normally makes no sense to retain old logs. That comes with some privacy issues of course, but more importantly, I have never needed it.
If you insist on running your daemon directly on a machine, for example by distributing it with a package repository so that apt install ... or dnf install ... allows the user to install it, you may consider using syslog or systemd as log destinations, and let the configuration on the machine deal with log retention. Or the Event Log for Windows system services, and os_log on Apple platforms.
Sometimes I need to see logs in real time when I debug an app. Some log libraries will not output anything until some internal buffer is full. That means that if you have a bug in the initialization of your app, the problem may occur, and stop further processing, without writing a single line of output from the log. That’s frustrating! If I have a log statement explaining a problem, I expect to see that in near real time from the app’s console output or log file.
If the log library wants to speed things up by omitting file flushes, that’s fine, but it still needs to flush the output within reasonable time. A daemon won’t necessarily exit (and flush the buffers) if it fails early, especially during development when some states are not handled properly yet. I know how tempting it is to drop that flush, because it does boost the performance of the log library on benchmarks. But even in production I often prefer to run with flushing of each log statement enabled, because if the server is idle for some reason and only outputs a single log message every few seconds, I want to see that message. That message and the frequency it comes with is likely to tell me a lot!
Some logging libraries use or can use dedicated threads for the logging. This might look like a very good idea, and in some cases it actually makes lots of sense. The advantage of using dedicated threads is that the thread that logs something will only spend a very short time capturing the log information, and then passing it on to another thread for formatting and distribution. This makes each log statement faster. If you write something that requires very low latency for its requests, it may be a requirement. And if you have a very high volume of log messages, like several thousand messages per second from a few busy threads, it also makes sense.
What you must account for is that although the time to call the log function drops, passing the data to another thread has several potential negative side effects for your application. By passing significant amounts of data between threads, you affect the CPU cache. Inside the common CPUs there is a per-core cache, the L1 cache. On hyper-threaded cores, two hardware threads share the same L1. When you move data between threads on different cores, the data frequently needs to be copied into another L1 cache in order for the CPU to read it. That means you get more “cache misses,” which slows down the CPU.
If the CPU is busy, the delayed processing of log events may cause the log event data to be completely evicted from the L2 and L3 caches as well, requiring the CPU to read it back into all three levels of cache from RAM at the time of actual processing. Another issue is the small overhead each runnable thread presents to the operating system. It’s generally better to spend the CPU cycles running code than switching between threads.
If your application is data- and CPU-intensive, logging threads could have a real negative impact on its performance. Identifying such indirect causes of performance loss is difficult. So in short, logging from the actual worker thread that creates the event is very often the best solution. As always, be conservative when deciding how many threads your application needs, and for what. The best overall performance is often achieved if your application is highly asynchronous, and has one software thread per CPU thread.
It’s worth noting though that all the logging libraries I’m aware of use blocking I/O to write to log files. If the volume is small (and the machine is not overloaded with disk IO ) that’s not a problem since the write will almost certainly go to the file cache and not to the actual slow I/O device. But with high-volume logging, we are likely to run out of cache from time to time and actually have to wait for very slow I/O operations to complete. It could be an interesting (and fun) experiment to create a logger that wrote from a C++ coroutine to Linux devices via io_uring.
How to handle errors if logging fails?
How do you deal with errors, like disk full, while logging?
It depends. In some cases, for example if the log is an audit log, you may need to detect it and shut down the application. An adversary may one day sabotage your audit log by filling the device with no-op events, and then do naughty things when the log no longer records what’s going on.
For normal applications, a full disk will not be a showstopper. Even if the log is off, the application will normally continue to handle metrics, so you will still be able to see how it is doing and get alarms (if those are defined) when something else bad is happening. Reporting full disks is normally also out of scope for the application. For production systems, there is usually automatic monitoring of the machine and each container, which should trigger alarms if resources are exhausted. If logs filling up the disks is even a remote possibility, you may want to put the logs on a different device or disk partition than the application’s state and data.
All the larger logging infrastructures I have worked with have used some kind of capturing of logs on the local machines with automatic copying to central log servers. They have all done this on a “best effort” basis, without any guarantees about 100% coverage. That was true with syslog-based central repositories, and it is still how, for example, the loki docker driver for logging works. If everything works, including the network, logs are collected. If the network goes down for a while, there will be corresponding holes in the central log data.
In my applications I usually write an error to stderr, and sometimes quit, if the initialization of logging fails. However, once initialized I don’t check for logging errors. In logfault, the log statements are noexcept, so log failures will go unnoticed. So far this has not caused any problems.
How do we log from smaller libraries?
This is a fascinating topic. When you write a library, you don’t have a say in how the application that consumes that library will handle logging. There are three common patterns:
- No logging – The library doesn’t log anything, and errors are reported to the caller via exceptions or error values. This is often fine for very simple libraries. It is also very tempting for any library writer, as it lets us focus 100% on the core function of the library.
- Log to stderr – This is common, and I have experienced it in many well-known libraries, including Google’s gRPC library. Normally, only warnings and errors are logged this way. It works with cloud applications, but the log format will be different than that of the application, so the results may not be optimal. For things running as daemons or Windows services, such logs will be invisible or even problematic.
- Log via a wrapper – This is usually the best option. The library has some simple logger that it uses internally to generate its log events, and then it forwards the events to another logger. The normal way to handle this in C++ is to call a function in the library and provide a functor or class implementation that matches the expectations of the library, and converts and forwards the log events to the logger used by the application.
In some of my libraries, I also offer a CMake option for the library to use logfault. If the application already uses logfault, the library will just use it as it is configured.
How do we log from containers
The simple way is to write your log messages to std::cout, std::clog, or std::cerr. Docker will capture everything you write to the console and forward it to some cloud log monster and/or store it in text files locally and handle retention based on the rules you (or DevOps) have applied.
If you use Kubernetes, you can also use sidecar containers for logging — but please step back and consider the complexity of your app. Having the option to do something amazing does not mean that you should do it. Everything we put in production needs to be tested properly and then maintained for a long time. Using resources on some fancy logging thing means that you have fewer resources for the actual daemon (or backend or microservice or whatever you are making).
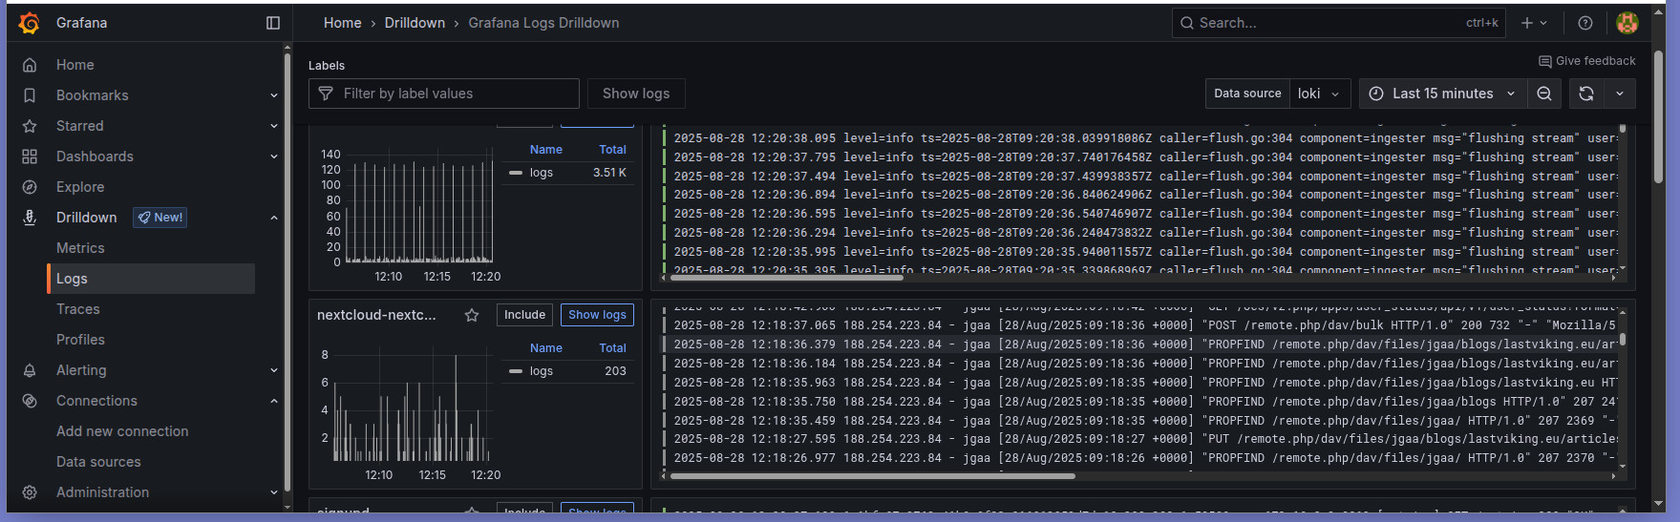
Logging in the cloud
I use Grafana and Loki for logging for my cloud VMs. All my daemons log in JSON format. The key benefit is that when I look at logs in Grafana, I control what gets displayed for each line. Lots of meta-information like thread ID, source code file and location, extra metadata like user ID or request ID are available, but only when I expand a log event to view the details. That makes it very simple to read the flow of the application in the log overview, and drill down into the details only for the events that stand out. The alternative is to pack everything together in one very long log message, or just omit the meta-information.
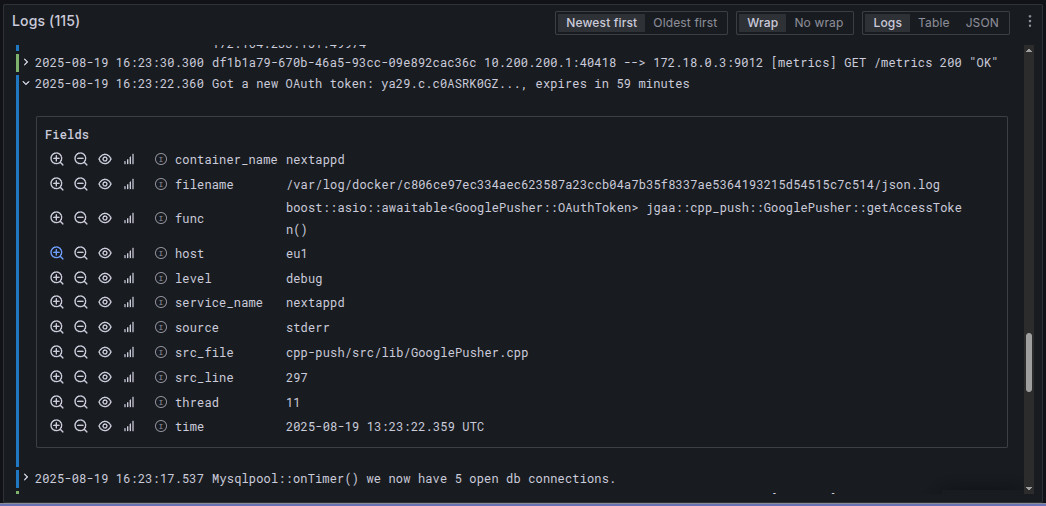
In this example we see three log events, with the second being expanded. The fields are Loki log fields like host and source merged with JSON entries from the application log like func and thread.
This particular daemon runs as a container in Docker on a Linode VM in Frankfurt, Germany. I use Ansible to deploy it. As part of the container spec, I set Loki as the Docker log driver for the container, and I tell Loki what JSON fields it must expect and how to map them. The following is from the Ansible playbook I use to upgrade the daemon. Notice the log_driver and log_options fields:
- name: Ensure nextappd container is up-to-date community.docker.docker_container: name: nextappd image: "{{ nextappd_repo }}:{{ deploy_tag }}" state: started restart_policy: always pull: yes recreate: true volumes: - "{{ push_service_file_dest }}:/etc/nextappd/{{ push_service_filename }}:ro" published_ports: - "{{ nextapp_port }}:10321" - "{{ nextapp_metrics_port }}:9012" # Metrics networks: - name: backend log_driver: "loki" log_options: loki-url: "{{ loki_url }}" loki-pipeline-stages: | - json: expressions: time: time log: log level: level func: func thread: thread src_file: src_file src_line: src_line - timestamp: source: time format: RFC3339 - output: source: log - labels: level: func: thread: src_file: src_line: time: command: > -C debug -c '' --db-host mariadb --metrics-host 0.0.0.0 --enable-metrics --disable-metrics-password -g 0.0.0.0:10321 --log-as-json-to-console --io-threads 8 --enable-push-notifications --google-push-service-file /etc/nextappd/{{ push_service_filename }}This is the raw log message that my daemon created and wrote to stdout:
As a side note: I do believe the Loki driver requires a little too much configuration here. It should be sufficient to give it JSON messages with some entity names it recognizes like log or msg for the text of the message, level, and time. Then it could treat anything else as metadata. This level of detail should only be required if you need to filter out entries you don’t want to send, or if your JSON format needs to be transformed to something Loki can understand.
Structured vs. unstructured logs
- Structured logs (JSON in our context) are meant to be processed by machines. The JSON format allows the log events to preserve a highly structured format, much like some C++ structure before the event was serialized. This allows us to search for specific tags like level or func or log events from a specific source file or source location. It also allows us to have a highly readable log message summarizing the relevant information, unobscured by all the details. On the negative side, JSON log events require more CPU cycles to create, take more space, and are less readable for us humans in their raw format. JSON is, however, very easy to compress. In compressed format, it is often similar in size to compressed unstructured logs.
- Unstructured logs are traditional text messages. They are usually formatted in a way that makes it possible for machines to parse parts of it into structured format (for example by declaring the ordering of elements, so that date, log level, source code location, function names, etc. can be made searchable). They are, however, also meant to be read by humans as-is. There are many different well-known formats. My experience is that as we pack more information into a log message, they get harder to process visually.
How to view logs
One option is to use less in combination with grep from the Linux command line. I often use that when I work on remote servers via ssh. It works, and the utilities are usually available (not in containers though — there I’m usually stuck with more).
When I develop, I usually use Linux with KDE. All the distributions I use have a good log viewer named glogg. It is very fast, can view really huge log files, and it has a split-screen that allows a filtered list of events in the lower window. It also updates the display as the log grows. So I can view the output from my app in real time with coloring.
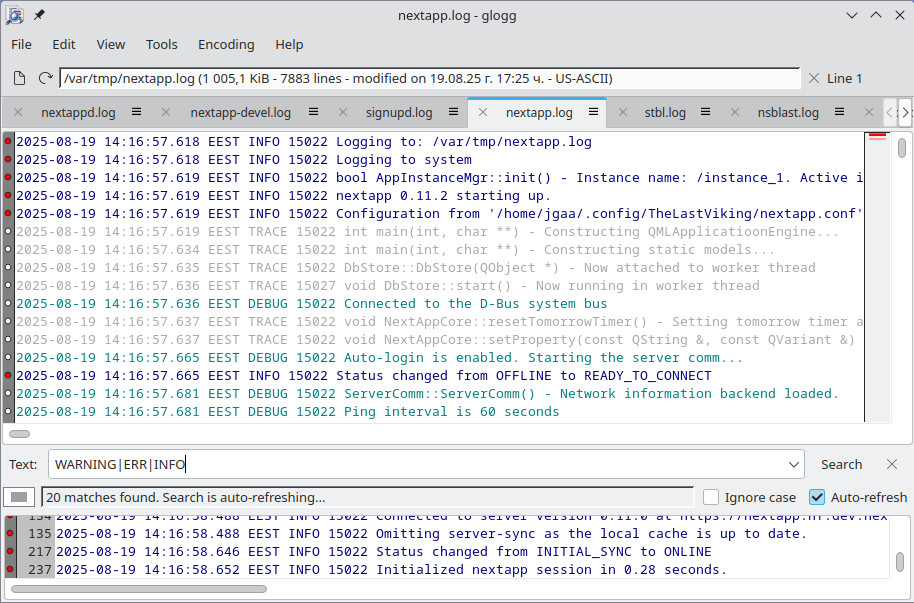
As you may notice, this log is in text format. I have not found (or written) a good desktop UI log viewer that handles JSON yet. So for logs that are meant to be manually inspected, I stick with text format.
I wrote a program similar to glogg when I worked on a Windows app 12–16 years ago. I couldn’t find any log viewer I liked, so I spent some weekends cooking together something that was fast, worked with huge files, and used colors to show the severity of the log messages. Viewing a log file with lots of DEBUG and TRACE messages without coloring is hard. As soon as there are colors, it’s blissfully simple to follow the flow of events.
A few years ago I worked for a client that made a globally distributed database. When we investigated problems, we sometimes turned on DEBUG log level on production servers. That generated really huge amounts of log events. They used an early version of Loki for central log management. The Loki/Grafana web console was totally useless. It could maybe display a window of 1000 log events — that was usually less than one second of output. In order to work with such logs, I used a CLI tool to download as large chunks of log data as Loki would allow (without crashing), concatenated them together, and then I used grep or glogg to find what I needed to diagnose a problem.
How do we get logs from Android?
When I work on Android apps, I use adb to fetch the logs in real time from my test device, and then I view the log file in glogg.
&& This command forgets about existing log events and starts writing new log events to the log file.
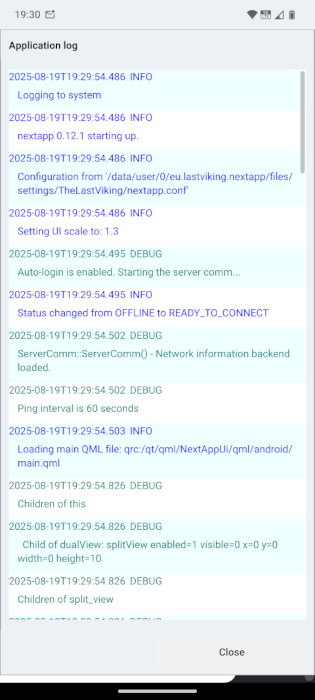
In the Android version of NextApp I log to a ring buffer in memory, in addition to the Android system log. This allows the user to view the application’s log in the app itself. I also have an option to log to a file under the public ~/Android/media/eu.lastviking.nextapp/Logs folder, so the user can copy the application log off the device, or view the full log on the device.
Privacy and security
Never expect your normal application logs to be secure. The best way to prevent sensitive data from leaking through logs is to not write any sensitive information there in the first place.
There are also legal aspects to consider regarding how long to retain certain facts. For example, you probably need to store the IP addresses of remote requests in order to handle abuse reports or provide the authorities with relevant information about breaches or illegal activity on your servers. On the other hand, there may be laws about how long you are allowed to keep this information before it must be deleted. You can handle this either by scrubbing the log databases for certain events or fields older than n days, or by simply expiring the logs after n days. Cloud storage is not free, so it makes no sense to keep old logs around unless you have an actual reason for it.
Then there is actual personal information and secrets. If you log, for example, the header of an authenticated HTTP request, you are likely to log the secret the user used to authenticate. My rule of thumb is to never log any personal information or data that may contain secrets at any level above TRACE. And never use TRACE level on any application handling production data.
In some applications you may also want to restrict this with a command-line argument, so that any log statement likely to contain a secret or personal information can only be logged if explicitly enabled. If you need to log something like HTTP headers and this option is disabled, or you must log it at DEBUG level, then scrub the sensitive parts so that if anyone bad got their hands on the logs, the information would be useless. It’s normally better to replace a secret with a fixed-length string than to hash it or even show its real length (for example, in the case of a password). The more information an attacker has about a secret, the greater the chances they will be able to guess or deduce it.
This is especially true now when bad actors use AI as well.
Logging matters
If you are thoughtful about logging, it pays off over time.
I implemented a crypto wallet as a C++ library for a mobile app some years ago. It targeted Android and iOS. I did not use Boost for this project, just plain C++, SQLite, and OpenSSL. For logging, I created a new project, logfault. I needed to create normal log files or console output for my development under Linux, and use the logging facilities in Android native and iOS when the library was used there. Since then, I have added to the library as I had new requirements, and I use it in all my projects today.
As I get older, I appreciate simplicity more and more. Logging is an area where we as developers and DevOps engineers often take routes that are much too complex. A log library should be simple to use. It should be difficult to use it incorrectly or in a way that wastes resources. It should behave as one would expect (like flushing its buffers), and it should support the log destination(s) your project needs. It should not expect you to spend hours or days studying its documentation in order to use it properly.
Logging is a pipeline from the log events created by an application, optionally via some methods for retention and retrieval, and then inspection. Each step should be as simple as possible. Complexity increases the risk of unexpected results, it wastes time, and it feeds frustration. The most important decision is not how to format or beautify the log events, but what to log and when. Having log messages with the relevant information at the right log level in the right locations is an art form. This is where we should spend our resources, so our colleagues and future selves understand what the application is doing, and eventually why it failed.
When I work on applications, daemons, or apps, I regularly inspect the output from TRACE-level logs to see if the information is meaningful, has the context I need, and if the messages are at the correct level. For example, having several messages on INFO level about a user authentication is usually just a form of spam. As I work on the code, I often use WARNING level for code paths I don’t expect to be chosen, and adjust or add more paths as I gain experience with the application and its libraries. When I work on a bug, I often add DEBUG-level log events to understand what happens, and then I downgrade them to TRACE-level messages when I’m done.
Finally, we must realize that logging is only one part of what a modern application needs to deliver for observability. The second major requirement is metrics. In my current server apps, I provide an HTTP interface with metrics in OpenMetrics format using yahat-cpp. With JSON logging and metrics, the system can be monitored in near real time, and dashboards can correlate anomalies in the metrics with log events. They also provide everything needed to set up automated alarms for the applications.
In modern observability, there is also distributed tracing, which together with logging and metrics makes it possible to view a complex system of applications—such as microservices—as a whole. In this post I focus on logging; I’ll return to tracing in a separate article.