After 40 years of writing software, one thing has become very clear to me: Logging is one of the most important skills in software engineering. No debugger, no AI tool, no fancy tracing system beats good logging when you’re trying to understand what a system is actually doing. Especially when it’s failing.
Ironically, as I was preparing LGX for beta in my spare time, I was recently reminded of this when I worked on NextApp. I spent four days trying to build a Flatpak package for it using GitHub Actions. Locally, the build script worked. On the GitHub runner, it failed. Again and again. Initially, I delegated the Flatpak issue to OpenAI's Codex and GitHub's Copilot. Eventually, I started working on the problem myself. The error was that some unknown command failed for some unknown reason. The fact that it failed was logged. But the message gave no hint about what or why.
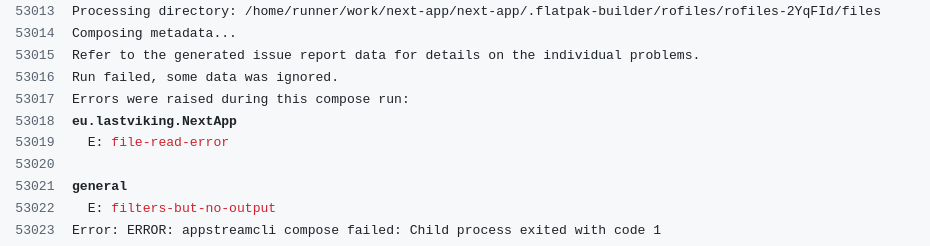
From these vague errors, both Codex and Copilot came up with a dozen good explanations and "fixes", none of which worked. After one full day of focused work, I traced the problem to this section in the GitHub workflow file:
jobs: build-flatpak: ... - name: Install Flatpak tooling run: | set -euo pipefail sudo apt-get -qq update sudo apt-get -qq install -y --no-install-recommends \ flatpak \ flatpak-builder \ rsyncThe --no-install-recommends option skipped something that appstreamcli compose needed in order to do its job. If the person who wrote the appstreamcli-compose code had added relevant information about what failed, my GitHub build would have failed once, and I would not even have needed to spend any time looking into the problem myself. Codex or Copilot would have fixed the build in seconds.
So, logging matters. A lot.
When I write my own software, I am careful to add logging, and to be thoughtful about it. I don't want a lot of spam. But I do want whatever information is relevant to understand how the system works and to see what it's actually doing right now. The latter is useful when I live-stream logs and follow the application in real time. And when something fails, I need the logs to explain properly what failed, what actually happened, and which error codes and other relevant information (including broken assumptions) caused the problem.
I have spent quite some time writing and speaking about this. I have also hacked together log viewers in the past to get the job done. Nothing I have released to the public, though. Until now.
Why I created lgx
In the past decade, I have worked exclusively using Linux with the KDE desktop. Some of the software I have made runs under other operating systems (or desktops) as well. I have used a log viewer called glogg that is OK, but not great. I always wanted something better.
Working more and more with AI agents to analyze or write code, and building much of what I make using CI, I spend lots of time every day just waiting. I decided to do something fun and useful while I waited, and started to work on lgx. Initially, it was something Codex wrote in Rust, but after the application gained some complexity, it just fell apart. So I started over, using C++ and Qt. I still used Codex for lots of the code, something that saved some time but became very frustrating over time. The AI agents still have a long way to go before they can make efficient software.
Like Grafana, and unlike glogg, lgx understands log structure. When it opens a log file, it starts by doing a quick scan over it to identify event boundaries and log levels. Not a deep scan, just the most essential information. This information is stored in an in-memory line index. It reads log files in large chunks and uses an internal shared reference-counted LRU cache to keep the most relevant chunks in memory. This design makes it possible to open really large log files. It has several log format parsers, so it can handle most logs well (and some very well). It uses lazy deep parsing, so the information required to show a nicely formatted log event in the UI is not extracted until a chunk is requested by the UI.
Some functions, like searching for the next warning or error, use meta-information on the chunk level to skip any chunks that don't contain log events at the requested level. That makes common operations like this very fast.
Since it scans the log lines for meta-information, coloring of log events is accurate. That means you can filter on error level or search for "error" in log messages, and the app understands that those are two different things.
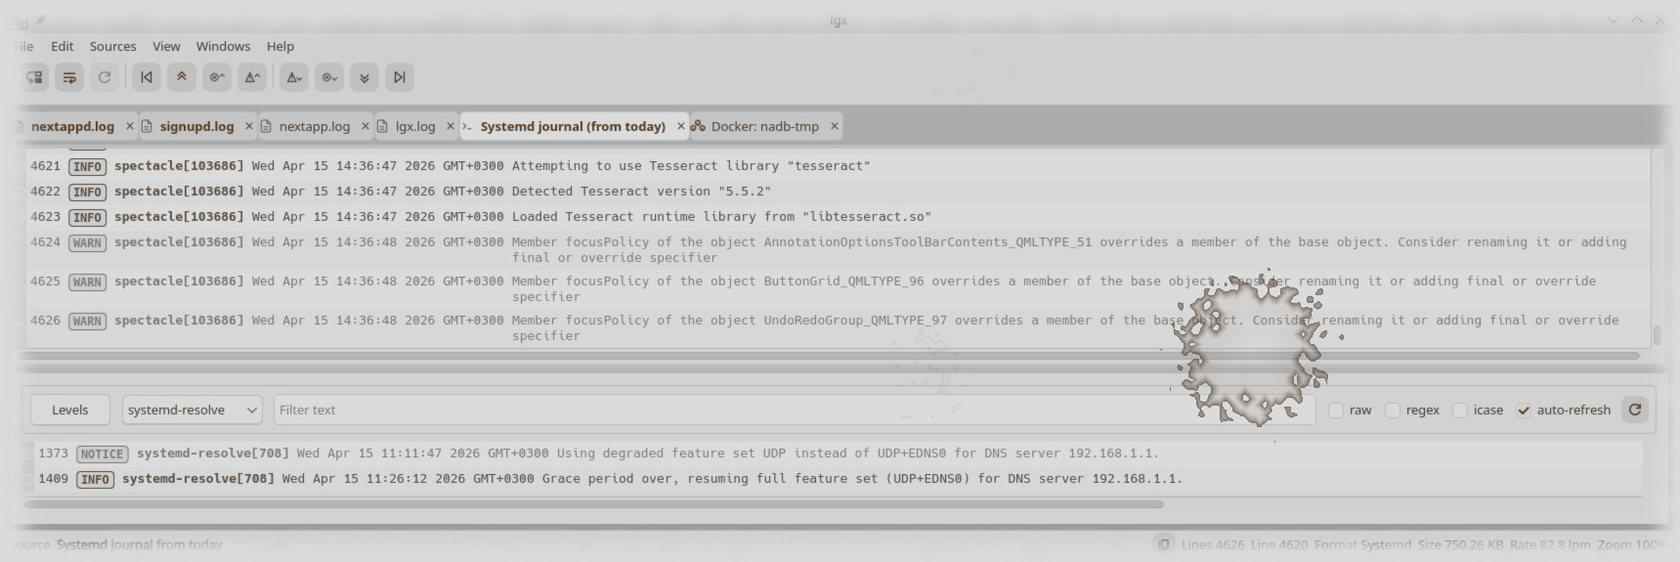
lgx can have several log files open at any time, and it can split the log view so that you can have panes with log events, filters, and marked log events. This is what makes the app really useful while analyzing a log file to pinpoint a problem.
In addition to files, the application can also open streams, from shell commands opened by something resembling popen to dialogs showing stream sources like running Docker containers or connected Android devices (logcat). It can also open the local systemd log if you use systemd.
I made the application to do everything I need from a log viewer. There are still features I want to add, like dedicated scanners for more log formats and state-of-the-art support for JSON logs. I will add stuff as I need it.
lgx is open source and available on GitHub. If you spend a lot of time reading logs, you might find it useful. And if you don’t - well, you probably should 🙂
PRs, feedback, and ideas are very welcome.